Name: BOC Steady Growth (R)
Code: 830002
Reporting Period: January 1 to June 30, 2011
I. Net Asset Value
The net asset values of BOC Steady Growth (R) from its establishment date are shown below:
| |
Establishment Date: April 16, 2007 |
June 30, 2011 |
% Change |
| a. MSCI China Indices (weighted 25%) |
5522.56 |
6720.59 |
21.69% |
| b. Hang Seng Index (weighted 25%) |
20757.7 |
22398.1 |
7.9% |
| c. USD Bond Index (weighted 50%) |
|
|
27.42% |
| d. Performance Benchmark (a×25% + b×25% + c×50%) |
|
|
21.11% |
| |
|
|
|
| e. Accumulated Net Asset Value Change of BOC Steady Growth (R) |
1 |
1.1205 |
12.05% |
| f. RMB Appreciation over the Reporting Period |
7.7284 |
6.4716 |
19.42% |
| g. Management Fee plus Custodian Fee over the Reporting Period |
|
|
3.37% |
| h. Outperformance Benchmark (e + f + g - d) |
|
|
13.73% |
Note: The returns of BOC Steady Growth (R) was distributed to its investors in November 2007, with a dividend of RMB 2 per 10 shares.
II. Structure of Holdings
As of June 30, 2011, the holdings of BOC Steady Growth (R) are shown below:
| Category |
Market Cap (RMB) |
Proportion |
| Equity Fund |
186,697,570.60 |
59.35% |
| Bond |
88,406,857.52 |
28.10% |
| Cash and Others |
39,464,977.42 |
12.55% |
| Lowest Rating of Invested Bonds |
AA+/Aa2 |
| Top 10 Holdings |
| Serial No. |
Name |
Category |
Rating |
Market Cap (RMB) |
Proportion |
| 1 |
Fidelity China Focus Fund |
China Equity Fund |
|
96,075,740.12 |
30.54% |
| 2 |
Credit Agricole Greater China Fund |
Greater China Equity Fund |
|
90,621,830.48 |
28.81% |
| 3 |
US T 2 3/4 02/15/19 |
U.S. Government Bond |
AAA/Aaa |
53,039,809.39 |
16.86% |
| 4 |
US TRE 3.75 11/15/18 |
U.S. Government Bond |
AAA/Aaa |
35,367,048.13 |
11.24% |
Top 10 Holdings of the Following Two Funds:
| |
Top 10 Holdings of Credit Agricole Greater China Fund(As of May 31, 2011) |
Top 10 Holdings of Fidelity China Focus Fund(As of May 31, 2011) |
| Serial No. |
Name |
Proportion % |
Name |
Proportion % |
| 1 |
ICBC |
8.20 |
TENCENT |
8.1 |
| 2 |
CCB |
7.71 |
ICBC |
7.5 |
| 3 |
CNOOC |
6.33 |
CNOOC |
6.3 |
| 4 |
CHINA UNICOM |
4.89 |
PING AN |
5.0 |
| 5 |
HSBC HOLDINGS |
4.88 |
CCB |
4.9 |
| 6 |
SHK PPT |
4.40 |
BELLE INT'L |
4.9 |
| 7 |
BANK OF CHINA |
4.30 |
MENGNIU DAIRY |
3.3 |
| 8 |
ABC |
4.00 |
CHINA MOBILE |
3.3 |
| 9 |
TENCENT |
3.64 |
CHINA LIFE |
3.0 |
| 10 |
HUTCHISON |
3.50 |
CHANGYU |
2.3 |
Source: Bank of China's website - Holdings Detail of BOC Steady Growth (R) as of June 30, 2011
III. Analysis of Market Movement and Operation
1. Hong Kong stock market movement in 1H 2011 (January 3 to June 30, 2011)
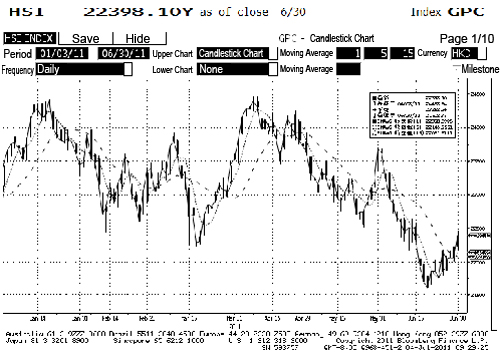
Source: Bloomberg
With Hang Seng Index (HSI) closed at 22,398 on June 30, the Hong Kong stock market dropped 2.77% over 1H 2011. In the first quarter, the market was boosted by the previous year's favorable financial reports and dividend payments of its listed companies. However, influenced by Japan's tsunami and nuclear crisis, Europe's debt crisis, and China's real-estate regulation policies, HSI hit its year-to-date low of 21,508 on June 20 as a result of worse performance of technology, financial and property shares, and then rebounded quickly following relief of Greece's debt crisis, control of China's inflation and a positive outlook on U.S. economic recovery. Although the Hong Kong stock market didn't performed well over the past half year, BOC Steady Growth (R) showed a better performance in its equity funds than HSI and large-cap stocks by selecting premium H-shares and incorporating the resources of other outstanding listed companies. As the financial center in Asia and the linkage of eastern and western stock markets, the Hong Kong stock market is an ideal market for investment and price discovery. The table below shows the performance of major global economies.
The stock market performance of key countries and regions over June and 1H 2011:
| Index |
Change over June |
Change over the Year |
| MSCI Emerging Markets Indices |
-1.86% |
-0.45% |
| MSCI BRIC Index |
-1.61% |
-1.90% |
| MSCI China Indices |
-4.40% |
-0.51% |
| BSE SENSEX 30 Index |
1.85% |
-8.11% |
| Brazil Bovespa Index |
-3.43% |
-9.96% |
| Russia RTS Index |
0.84% |
7.71% |
| Mexico Composite Index |
2.02% |
-5.17% |
| SSE Composite Index |
0.68% |
-1.64% |
| SET Index |
-3.01% |
0.84% |
| MSCI World Index |
-1.73% |
3.99% |
| Dow Jones Industrial Average |
-1.24% |
7.23% |
| U.S. S&P 500 Index |
-1.83% |
5.01% |
| Nikkei 225 Index |
1.26% |
-4.04% |
| German DAX 30 Index |
1.13% |
6.68% |
| UK FTSE 100 Index |
-0.74% |
0.78% |
| France CAC40 Index |
-0.62% |
4.66% |
| Hong Kong Hang Seng Index |
-5.43% |
-2.77% |
| S&P/ASX 200 Index |
-2.13% |
-2.89% |
Source: Bank of China Wealth Management, Issue 6, 2011
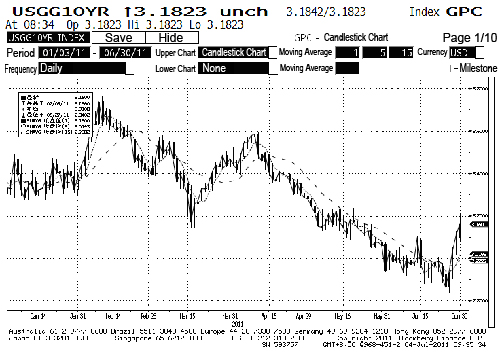
2. USD bond market movement
10-year U.S. treasury yield chart (January 3 to June 30, 2011)

Source: Bloomberg
In the first half of 2011, the U.S. treasury market was one of the foci in the international financial markets. On one hand, the party led by bond-fund maven Bill Gross expressed their extremely bearish outlook on U.S. treasuries in March and April; Standard and Poor's cut the U.S. ratings outlook to negative on April 18 for the first time; the hard talk between the Republicans and Democrats on federal debt ceiling was still under way. On the other hand, influenced by Europe's especially Greece's debt crisis, Japan's nuclear crisis and tensions in Libya, the yield of U.S. treasuries was pushed down with continuously rising prices, and the 10-year treasury yield once hit a low of 2.84% on June 27. The movement of the U.S. treasury market over the first half of the year proves its multiple roles of investment, protection of asset value, and absorption of USD liquidity, showing U.S. treasuries are important instruments for long-term investment and collective wealth management products.
3. Investment operation analysis
Equity fund assets:
In the past six months, by selecting premium H-shares and incorporating the resources of other outstanding listed companies, BOC Steady Growth (R) achieved a better performance in its equity funds than HSI and large-cap stocks against the poor performance of the Hong Kong stock market. The bank keeps on improving the net asset value of the product on the basis of independent operation and management, and has taken the following actions depending on the specific situation: increasing the proportion of equity funds at low prices early in the year; selling partial equity funds at high prices before Japan's nuclear crisis against an uncertain international situation in mid March; before Goldman Sachs closed out CCCP (crude oil, copper, cotton and platinum long positions) basket trade in mid April, selling partial equity funds at high prices against a relatively high level of global stock markets, particularly the emerging markets. With these actions, BOC Steady Growth (R) performed better than the large-cap stocks and exceeded the performance benchmark. As of June 30, the equity funds accounted for 59.35% of the total assets. Stocks in respect of finance, consumption, new energy and new economy gradually take a large proportion in the equity fund portfolio.
Bond assets:
The first half of 2011 witnessed a complicated and challenging U.S. treasury market: Standard and Poor's cut the U.S. ratings outlook to negative; the hard talk between the Republicans and Democrats on federal debt ceiling was still under way, which further caused fluctuation in the treasury prices; influenced by Europe's especially Greece's debt crisis, Japan's nuclear crisis and tensions in Libya, the yield of U.S. treasuries was pushed down with continuously rising prices. To mitigate the potential credit risk in Europe, and seize favorable market opportunities, the bank sold the Eurodollar bonds at a high price, which were issued by the International Bank for Reconstruction and Development, and purchased by the bank in 2008, making great contribution to the investors with a capital gain of USD 360,000. As of June 30, the bonds held, U.S. treasuries with high safety and liquidity, accounted for 28.1% of the total assets.
In respect of exchange rate, the bank continued to exert its traditional advantage in exchange rate trading and control of exchange rate risk, as well as its unique advantage in independent management of daily operation of QDII products. Against the prediction of RMB appreciation over a medium term, the bank, by means of spot foreign exchange purchase and sale and extension of USD/RMB swap term, minimized the risk of RMB appreciation at the right time in accordance with the provisions of the product manual, and finally improved the total returns of the product effectively.
With the above strategies, the product, after deduction of various fees, achieved a historically best performance as of June 30, 2011, 1373 bps above the performance benchmark.
IV. Market Outlook and Investment Strategy
1. Hong Kong stock market outlook and investment strategy:
In the second half of 2011, the bank will take a prudent and positive attitude to global economy and major stock markets, in particular the Hong Kong stock market based on its first-half's study on global economy, finance and stock markets, its actual operation in relevant markets, communication with investment managers of famous international investment institutions, and the opinions of the bank's market research team. On one hand, many negative factors prevent the stock markets from rising significantly, including less employment opportunities in the U.S., the hard talk between the Republicans and Democrats on federal debt ceiling, uncertainty of Europe's debt crisis, and concerns about China's inflation. On the other hand, the U.S. speeds up the retreat of its troops from other regions, and cuts the government deficits by tightening Medicaid and Medicare; the International Monetary Fund and European Union co-provide loans to Greece; the People's Bank of China controls inflation with interest rates and quantitative measures. All these actions give great support and inject confidence to international capital markets. Particularly the stock markets, including the Hong Kong stock market, of emerging economies have carried out a complete adjustment in the second quarter. For investment of equity funds in the second half, with its advantage of independent operation and active management, the bank will, in addition to the investment of core assets, closely follow the pace of market to implement the strategy of selling at high prices and purchasing at low prices for part of the holdings, and endeavor to mitigate risks and improve returns based on Hong Kong's economy and the operation performance of local enterprises.
2. Investment strategy of U.S. bonds
In the first half of 2011, U.S. treasury prices keep soaring as a result of Europe's especially Greece's debt crisis, Japan's nuclear crisis, tensions in Libya and other international emergency events. On the other hand, there is a risk of downgrade of U.S. treasury ratings because of the under-way hard talk between the Republicans and Democrats on federal debt ceiling. With both favorable and unfavorable economic data in the U.S., the economy is likely to recover gradually and the treasury yield to rise following the trend of employment increase in private-sector industries, increase in home sales and decrease in trade deficit. The bank will determine the medium- and long-term strategies for bond investment depending on the results of the debt ceiling talk. In the long run, investment in bonds not only balances the equity fund investment, but also allows investors to share the benefit from price rise and interest in the bond markets. The bank will continue to improve the net asset value of the product with right actions at the right time based on its traditional advantage in international bond investment and trading.
3. Exchange rate exposure and liquidity management
There is still a high expectation on rise of RMB exchange rate in the near future. Thus in the second half, to the extent permitted by the product manual, the bank will minimize the exchange rate risk arising from RMB appreciation over a long term at the right time by means of foreign exchange purchase and sale and extension of USD/RMB swap term.
4. Liquidity management
BOC Steady Growth (R) is characterized by flexibility. With a mechanism of daily evaluation of the product, customers can purchase and redeem it on a daily basis. The bank will constantly improve the liquidity management to ensure the capital utilization efficiency and returns and fully meet customers' liquidity demand by streamlining cash flow management, reasonably scheduling the maturity date of different transactions, and utilizing various facilities, such as spot and forward foreign exchange trading, and currency swap.
Bank of China Limited
July 12, 2011
|

