Name: BOC Emerging Market (R)
Code: 830018
Reporting Period: January 1 to June 30, 2011
I. Net Asset Value
The net asset values of BOC Emerging Market (R) from its establishment date are shown below:
| |
Establishment Date: October 30, 2007 |
June 30, 2011 |
% Change |
| a. MSCI China Indices (weighted 30%) |
10585.4 |
6720.59 |
-36.51% |
| b. MSCI Emerging Markets Indices (weighted 40%) |
1331.97 |
1146.22 |
-13.946% |
| c. U.S. Treasury Index (weighted 30%) |
|
|
20.82% |
| d. Performance Benchmark (a×30% + b×40% + c×30%) |
|
|
-10.285% |
| |
|
|
|
| e. Net Asset Value |
1 |
0.9566 |
-4.34% |
| f. RMB Appreciation over the Reporting Period |
7.4715 |
6.4716 |
15.45% |
| g. Management Fee plus Custodian Fee over the Reporting Period |
|
|
2.935% |
| h. Outperformance Benchmark (e + f + g - d) |
|
|
24.33% |
Note 1: After funds raising completed on October 24, 2007 and required accounts opened, the bank started operating BOC Emerging Market (R) in the stock and bond markets on October 30, 2007. Therefore, the indexes of relevant markets on October 30, 2007 are the benchmark of the product's net asset value.
Note 2: Performance benchmark: for the USD part, MSCI China Indices (30%) + MSCI Emerging Markets Indices (40%) + Lehman Brothers U.S. Treasury Index (1 to 10 years) (30%). Outperformance benchmark: net asset value, rise of RMB/USD rate, management fee and custodian fee within the reporting period should be taken into account.
II. Structure of Holdings
As of June 30, 2011, the holdings of BOC Emerging Market (R) are shown below:
| Category |
Market Cap (RMB) |
Proportion |
| Equity Fund |
1,302,126,764.00 |
81.39% |
| Bond |
- |
0.00% |
| Cash and Others |
297,810,127.99 |
18.61% |
| Lowest Rating of Invested Bonds |
AAA/Aaa |
| Top 10 Holdings |
| Serial No. |
Name |
Category |
Rating |
Market Cap (RMB) |
Proportion |
| 1 |
First State China Growth Fund |
Greater China Equity Fund |
|
728,012,668.97 |
45.50% |
| 2 |
MSCI Emerging Markets Equity Fund |
Emerging Markets Equity Fund |
|
454,842,247.44 |
28.44% |
| 3 |
Templeton BRIC Fund |
Emerging Markets Equity Fund |
|
119,271,847.59 |
7.45% |
Top 10 Holdings of the Following Three Funds:
| |
Top 10 Holdings of First State China Growth Fund (As of May 31, 2011) |
| Serial No. |
Name |
Proportion% |
| 1 |
CNOOC |
5.6 |
| 2 |
ENN ENERGY |
4.8 |
| 3 |
CHANGYU |
4.7 |
| 4 |
CHINA OILFIELD |
4.1 |
| 5 |
CHINA RES POWER |
4.0 |
| 6 |
CCB |
3.8 |
| 7 |
CHINA TELECOM (HONG KONG) |
3.7 |
| 8 |
CM BANK |
3.5 |
| 9 |
CHINA COMSERVICE |
3.4 |
| 10 |
BELLE INT'L |
2.9 |
| |
Top 10 Holdings of Templeton BRIC Fund(As of May 31, 2011) |
Top 10 Holdings of MSCI Emerging Markets Equity Fund(As of May 31, 2011) |
| Serial No. |
Name |
Proportion% |
Name |
Proportion% |
| 1 |
VALE |
8.65 |
SAMSUNG ELECTRONICS |
2.93 |
| 2 |
YANZHOU COAL |
6.58 |
LUKOIL |
2.21 |
| 3 |
PETROCHINA |
5.88 |
AMERICA MOVIL |
2.11 |
| 4 |
ITAU UNIBANCO HOLDING |
4.78 |
HYUNDAI MOTOR (South Korea) |
1.79 |
| 5 |
BANCO BRADESCO |
4.45 |
CCB |
1.58 |
| 6 |
MINING AND METALLURGICAL CO NORILSK NICKEL (Russia) |
4.4 |
NASPERS LIMITED |
1.57 |
| 7 |
HINDALCO INDUSTRIES LIMITED |
3.95 |
PETROLEO BRASILEIRO |
1.56 |
| 8 |
PETROLEO BRASILEIRO |
3.79 |
VALE |
1.56 |
| 9 |
SINOPEC |
3.49 |
ITAU UNIBANCO HOLDING |
1.53 |
| 10 |
GAZPROM |
3.26 |
MTN GROUP, LTD. (South Africa) |
1.40 |
Source: Bank of China's website - Holdings Detail of BOC Emerging Market (R) as of June 30, 2011
III. Analysis of Market Movement and Operation
1. Overview of global emerging stock market movement in 1H 2011
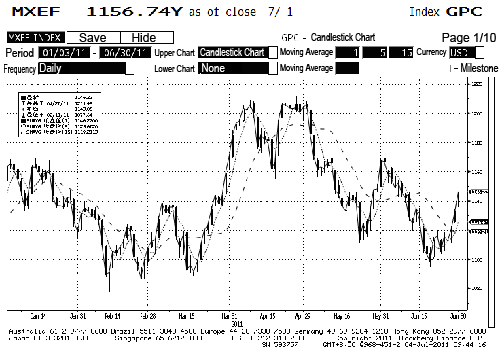
MSCI Emerging Markets Indices Chart (January 3 to June 30, 2011)

Source: Bloomberg
MSCI China Indices Chart (January 3 to June 30, 2011)
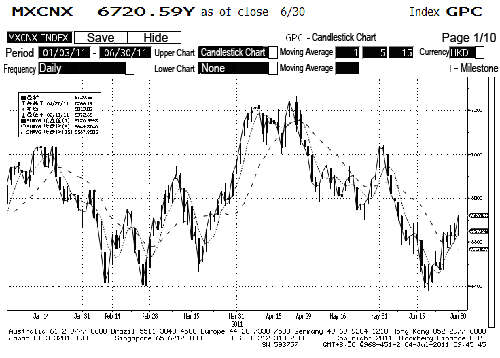
Source: Bloomberg
The first half of 2011witnessed rises and falls in global stock markets: the markets of developed countries, especially the U.S. and German stock markets, had a favorable performance, while that of emerging countries, except the Russian stock market, fell and adjusted within different ranges. Against the backdrop of excessive US dollars lifting commodity prices as a result of two rounds of quantitative easing by the U.S., emerging markets were under a high pressure of imported inflation. Brazil, India and China applied interest rate hike to curb it. While Russia, a large exporter of crude oil and natural gas, benefited most. These facts also prove the complementarity of BRIC countries in economy, as well as the system stability from investment in BRIC's equity funds and right investment orientation of the product.
The stock market performance of key countries and regions over June and 1H 2011:
| Index |
Change over June |
Change over the Year |
| MSCI Emerging Markets Indices |
-1.86% |
-0.45% |
| MSCI BRIC Index |
-1.61% |
-1.90% |
| MSCI China Indices |
-4.40% |
-0.51% |
| BSE SENSEX 30 Index |
1.85% |
-8.11% |
| Brazil Bovespa Index |
-3.43% |
-9.96% |
| Russia RTS Index |
0.84% |
7.71% |
| Mexico Composite Index |
2.02% |
-5.17% |
| SSE Composite Index |
0.68% |
-1.64% |
| SET Index |
-3.01% |
0.84% |
| MSCI World Index |
-1.73% |
3.99% |
| Dow Jones Industrial Average |
-1.24% |
7.23% |
| U.S. S&P 500 Index |
-1.83% |
5.01% |
| Nikkei 225 Index |
1.26% |
-4.04% |
| German DAX 30 Index |
1.13% |
6.68% |
| UK FTSE 100 Index |
-0.74% |
0.78% |
| France CAC40 Index |
-0.62% |
4.66% |
| Hong Kong Hang Seng Index |
-5.43% |
-2.77% |
| S&P/ASX 200 Index |
-2.13% |
-2.89% |
Source: Bank of China Wealth Management, Issue 6, 2011
2. USD bond market movement
10-year U.S. treasury yield chart (January 3 to June 30, 2011)
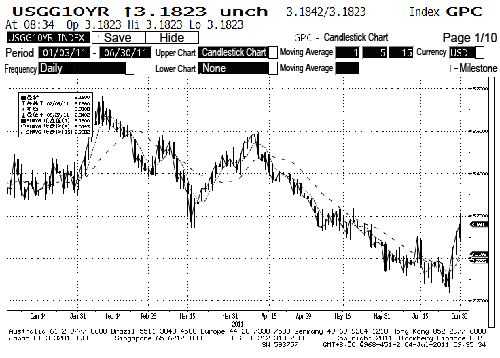
Source: Bloomberg
In the first half of 2011, the U.S. treasury market was one of the foci in the international financial markets. On one hand, the party led by bond-fund maven Bill Gross expressed their extremely bearish outlook on U.S. treasuries in March and April; Standard and Poor's cut the U.S. ratings outlook to negative on April 18 for the first time; the hard talk between the Republicans and Democrats on federal debt ceiling was still under way. On the other hand, influenced by Europe's especially Greece's debt crisis, Japan's nuclear crisis and tensions in Libya, the yield of U.S. treasuries was pushed down with continuously rising prices, and the 10-year treasury yield once hit a low of 2.84% on June 27. The movement of the U.S. treasury market over the first half of the year proves its multiple roles of investment, protection of asset value, and absorption of USD liquidity, showing U.S. treasuries are important instruments for long-term investment and collective wealth management products.
3. Investment operation analysis
The bank has studied the economic data and different stages of the economic cycle of major economies in the world, particularly emerging markets, paid great attention to the Russian market with excellent performance in the first half of the year, and also increased the holdings of three Russian equity funds after repeated communication with their fund managers. The bank keeps on improving the net asset value of the product on the basis of independent operation and management, and has taken the following actions depending on the specific situation: increasing the proportion of equity funds at low prices earlier this year; selling partial equity funds at high prices before Japan's nuclear crisis against an uncertain international situation in mid-March; before Goldman Sachs closed out CCCP (crude oil, copper, cotton and platinum long positions) basket trade in mid-April, selling partial equity funds at high prices against a relatively high level of global stock markets, particularly the emerging markets. With these actions, BOC Emerging Market (R) performed better than the large-cap stocks and exceeded the performance benchmark. As of June 30, the equity funds accounted for 81.39% of the total assets. Stocks in respect of mineral, energy and financial sectors of emerging countries, including Brazil, Russia, India, South Africa, Mexico and China, gradually take a large proportion in the equity fund portfolio.
For bond investment, in the second quarter, following the continuous rise of 10-year U.S. treasury price, the bank sold the FHLB (Federal Home Loan Bank) bonds held at the right time, which were purchased in 2008 at a value of USD 10 million, earning a capital gain of USD 470,000. The operation also states the bank's objective of realizing the maximum returns in an active and prudent manner on the basis of protection of customers' capital invested in QDII products.
In respect of exchange rate, against the prediction in early 2011 of RMB appreciation, the bank, by means of foreign exchange purchase and sale and extension of USD/RMB swap term, minimized the risk of RMB appreciation at the right time in accordance with the provisions of the product manual, and finally improved the total returns of the product effectively.
With the above strategies, the product, after deduction of various fees, achieved an excellent performance as of June 30, 2011, 2433 bps above the performance benchmark.
IV. Market Outlook and Investment Strategy
1. Outlook of emerging markets and global stock markets and investment strategy:
In the second half of 2011, the bank will take a prudent and positive attitude to global economy and major stock markets, in particular the Hong Kong stock market based on its first-half's study on global economy, finance and stock markets, its actual operation in relevant markets, communication with investment managers of famous international investment institutions, and the opinions of the bank's market research team. On one hand, many negative factors prevent the stock markets from rising significantly, including less employment opportunities in the U.S., the hard talk between the Republicans and Democrats on federal debt ceiling, uncertainty of Europe's debt crisis, and concerns about China's inflation. On the other hand, the U.S. speeds up the retreat of its troops from other regions, and cuts the government deficits by tightening Medicaid and Medicare; the International Monetary Fund and European Union co-provide loans to Greece; the People's Bank of China controls inflation with interest rates and quantitative measures. All these actions give great support and inject confidence to international capital markets. Most BRIC stock markets have carried out a complete adjustment in the second quarter. For investment of equity funds in the second half, with its advantage of independent operation and active management, the bank will, in addition to the investment of core assets, closely follow the pace of market to implement the strategy of selling at high prices and purchasing at low prices for part of the holdings, and endeavor to mitigate risks and improve returns based on emerging markets' economy and the operation performance of local enterprises.
2. Investment strategy of U.S. bonds
In the first half of 2011, U.S. treasury prices keep soaring as a result of Europe's especially Greece's debt crisis, Japan's nuclear crisis, tensions in Libya and other international emergency events. On the other hand, there is a risk of downgrade of U.S. treasury ratings because of the under-way hard talk between the Republicans and Democrats on federal debt ceiling. With both favorable and unfavorable economic data in the U.S., the economy is likely to recover gradually and the treasury yield to rise following the trend of employment increase in private-sector industries, increase in home sales and decrease in trade deficit. The bank will determine the medium- and long-term strategies for bond investment depending on the results of the debt ceiling talk. In the long run, investment in bonds not only balances the equity fund investment, but also allows investors to share the benefit from price rise and interest in the bond markets. The bank will continue to improve the net asset value of the product with right actions at the right time based on its traditional advantage in international bond investment and trading.
3. Exchange rate exposure and liquidity management
There is still a high expectation on rise of RMB exchange rate in the near future. Thus in the second half, to the extent permitted by the product manual, the bank will minimize the exchange rate risk arising from RMB appreciation over a long term at the right time by means of foreign exchange purchase and sale and extension of USD/RMB swap term.
4. Liquidity management
BOC Emerging Market (R) is characterized by flexibility. With a mechanism of daily evaluation of the product, customers can purchase and redeem it on a daily basis. The bank will constantly improve the liquidity management to ensure the capital utilization efficiency and returns and fully meet customers' liquidity demand by streamlining cash flow management, reasonably scheduling the maturity date of different transactions, and utilizing various facilities, such as spot and forward foreign exchange trading, and currency swap.
Bank of China Limited
July 20, 2011
|

